Ifeyinwa Ezeanokwasa (BI, FA & DA) Ifeyinwa Ezeanokwasa (BI, FA & DA)
Ifeyinwa Ezeanokwasa (BI, FA & DA)
find with me

Projects Category: External Link

  • Home
  • External Link
External Link
1127

BUSINESS EXPANSION / BUSINESS INTELLIGENCE (BEBI): Dashboard for Tracking Progress and KPIs on Business Profitability and Expansion by Ifeyinwa Ezeanokwasa

BUSINESS EXPANSION / BUSINESS INTELLIGENCE (BEBI): Dashboard for Tracking Progress and KPIs on Business Profitability and Expansion by Ifeyinwa Ezeanokwasa

Through a wide variety of mobile applications, we’ve developed a unique visual system.

  • Client PQPLUS
  • Date April 2024
  • Services Developed a Progress Tracking Dashboard displaying key performance indicators (KPIs) related to business profitability and expansion.
LIKE THIS 1127
VIEW PROJECT

  BUSINESS EXPANSION/BUSINESS INTELLIGENCE (BEBI)BUSINESS EXPANSION/BUSINESS INTELLIGENCE (BEBI)

Apr 2024 – May 2024Apr 2024 – May 2024

 
Associated with PQP Marketing Consult

    • Overview:
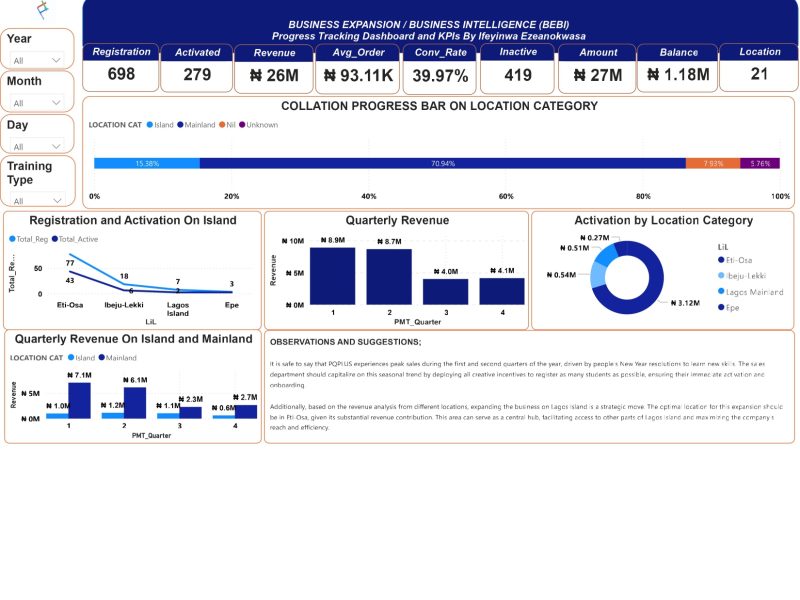
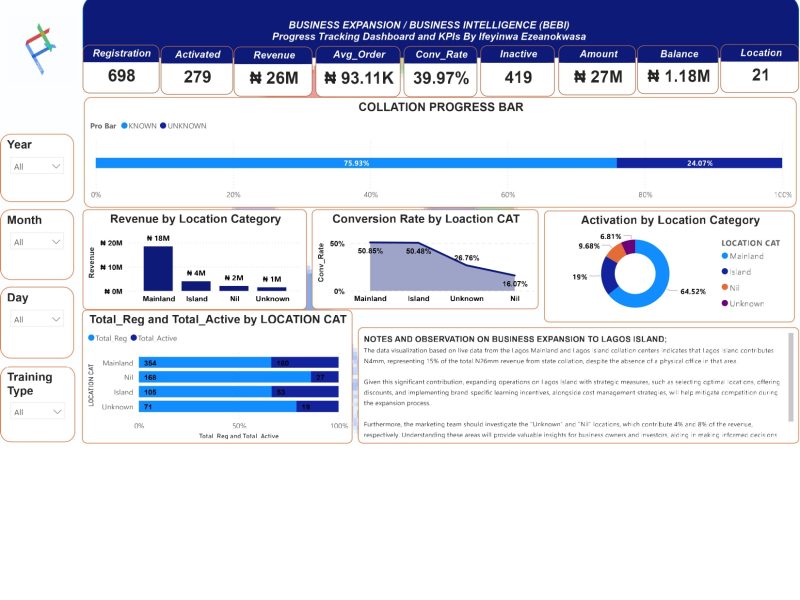
      PQPlus is implementing a strategic expansion by establishing a new training hub in the Island area of Lagos State, Nigeria. The Data Analytics and Business Intelligence team played a pivotal role in collating and analyzing Lagos Weekend and Lagos Midweek student registration data to support this decision-making process. The project aims to increase market reach, optimize revenue, and strategically grow the business.

      Features:

      Dashboard:

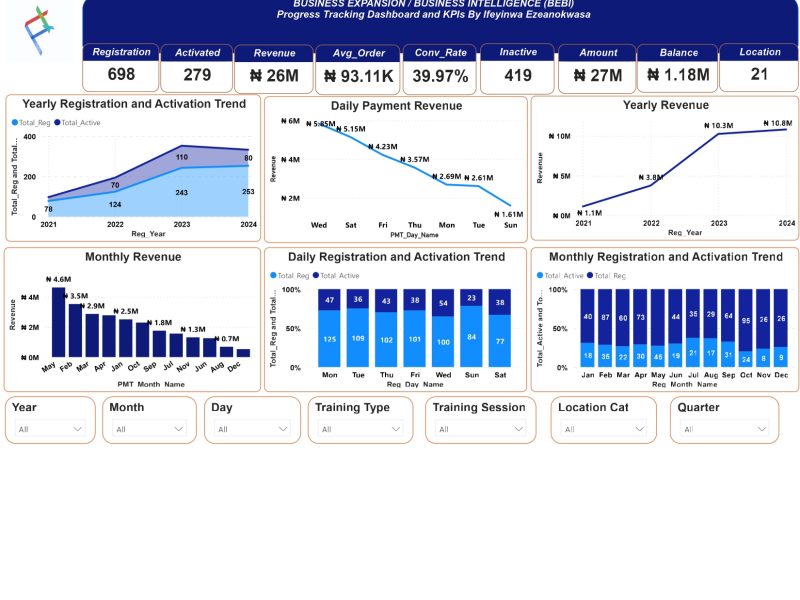
      An easy-to-understand dashboard that provides real-time insights into candidate registrations, revenue generation, and the data collation process in a user-friendly format.
      Technologies Used:

      Power BI (ETL and Power Query) for data cleaning and transformation.
      Observations:

      1. Higher revenue generation observed.
      2. Improved efficiency in tracking candidate registrations and payments.
      3. Informed decision-making enabled by accurate data insights.
      4. Targeted expansion strategy for optimal market penetration of the Island part of Lagos using the Pro Bar on the dashboard.

      Design Thinking:

      During the project building phase, the following were considered:

      1. Tracking candidate registrations, payments, and their locations (Island or Mainland).
      2. Developing a progress chart indicating data collation advancement.
      3. Displaying registration distribution between the Mainland and the Island.
      4. Comparing revenue from the Island area of Lagos with the Mainland.

      Components of the Dashboard/Report:

      1. Progress Bar
      2. Conversion Rate Bar
      3. Candidate Locations
      4. Daily, Monthly, and Yearly Revenue
      5. Location Category
      6. Total Activations by Year 

    • Skills: Microsoft Power BI · Microsoft Power Query · Business Development · Business Strategy · Business Analysis · Business Intelligence (BI) · Business Process Improvement.

External Link
930

PQPLUS REAL TIME VISIBILITY DASHBOARD.

PQPLUS REAL TIME VISIBILITY DASHBOARD.

A real-time visibility dashboard provides instantaneous insights into various aspects of a business’s operations. It aggregates and displays data from multiple sources, allowing users to monitor key performance indicators (KPIs) in real-time. This type of dashboard helps businesses make informed decisions quickly by presenting up-to-date information on metrics such as sales, inventory levels, customer behavior, and operational efficiency. By offering a comprehensive view of the current status, a real-time visibility dashboard enhances situational awareness, supports proactive management, and facilitates swift responses to emerging trends or issues.

LIKE THIS 930
VIEW PROJECT
REAL TIME VISIBILITY DASHBOARD (DATA VISUALIZATION)REAL TIME VISIBILITY DASHBOARD (DATA VISUALIZATION)

Mar 2024 – Apr 2024Mar 2024 – Apr 2024

 
    Associated with PQP Marketing Consult Associated with PQP Marketing Consult
    • Overview:
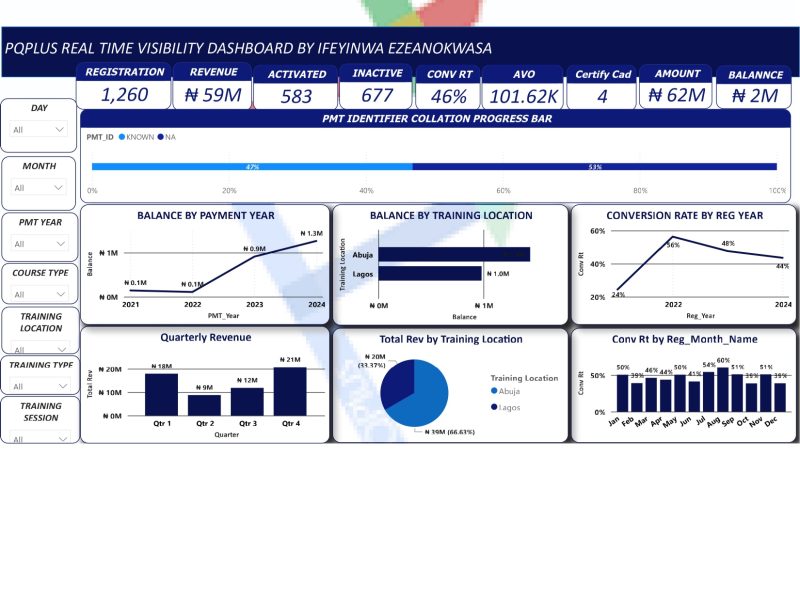
      PQPlus offers digital skill acquisition services globally, with centers in Lagos and Abuja, Nigeria. The Real-Time Visibility Dashboard aims to improve student registration efficiency, increase conversion rates by 75%, and boost student activations. The company struggled with KPIs meeting only 50% of targets, highlighting the need for optimized business processes to enhance revenue and customer satisfaction.

      Features:

      Dashboard:
      User-friendly, real-time data tracking and display.

      Technologies Used:
      Power BI (ETL and Power Query) for data cleaning and transformation.

      Observations:

      Data Accuracy: Accurate data capture ensured reliable insights and decisions.

      Operational Efficiency: Real-time revenue insights improved operational efficiency.

      Cost Savings: Real-time issue identification prevented costly mistakes and inefficiencies.

      Customer Satisfaction: Enhanced customer satisfaction through quick response to needs and issues.

      Scalability: System scaled with business growth, increasing the number of activated students and conversion rates.

      Design Thinking: Management’s focus on increasing conversion rates generated increased revenue.

      Components of the Dashboard/Report:

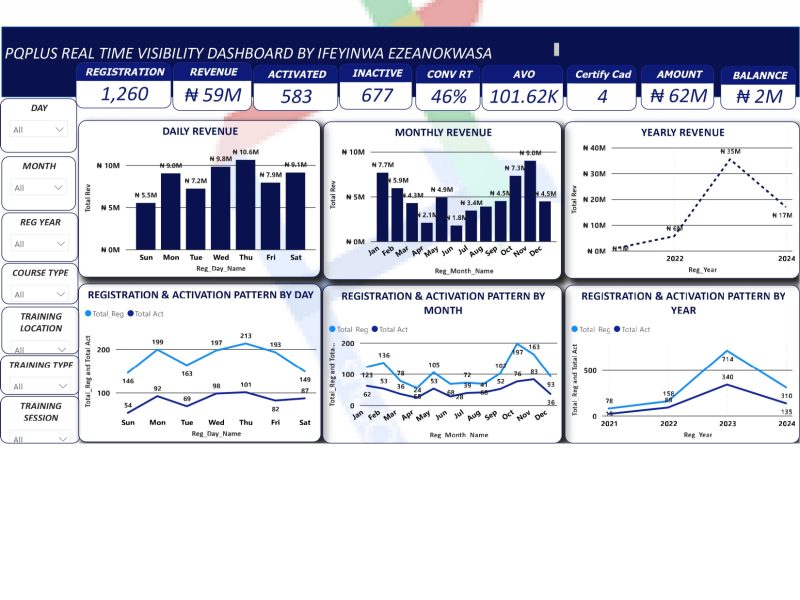
      Total Revenue: Graphs showing revenue by day, month, quarter, and year.

      Revenue by Time and Location: Detailed revenue breakdowns by time and location.

      Conversion Rate: Charts displaying conversion rates by month and year.

      Activation and Registration Patterns: Patterns of student activation and registration by day, month, and year.

    • Skills: Microsoft Power Query · Microsoft Power BI · Business Development · Business Strategy

Featured posts

Categories

  • No categories

Find Me

© 2025. Ifeyinwa Ezeanokwasa