Overview:
PQPlus offers digital skill acquisition services globally, with centers in Lagos and Abuja, Nigeria. The Real-Time Visibility Dashboard aims to improve student registration efficiency, increase conversion rates by 75%, and boost student activations. The company struggled with KPIs meeting only 50% of targets, highlighting the need for optimized business processes to enhance revenue and customer satisfaction.
Features:
Dashboard:
User-friendly, real-time data tracking and display.
Technologies Used:
Power BI (ETL and Power Query) for data cleaning and transformation.
Observations:
Data Accuracy: Accurate data capture ensured reliable insights and decisions.
Operational Efficiency: Real-time revenue insights improved operational efficiency.
Cost Savings: Real-time issue identification prevented costly mistakes and inefficiencies.
Customer Satisfaction: Enhanced customer satisfaction through quick response to needs and issues.
Scalability: System scaled with business growth, increasing the number of activated students and conversion rates.
Design Thinking: Management’s focus on increasing conversion rates generated increased revenue.
Components of the Dashboard/Report:
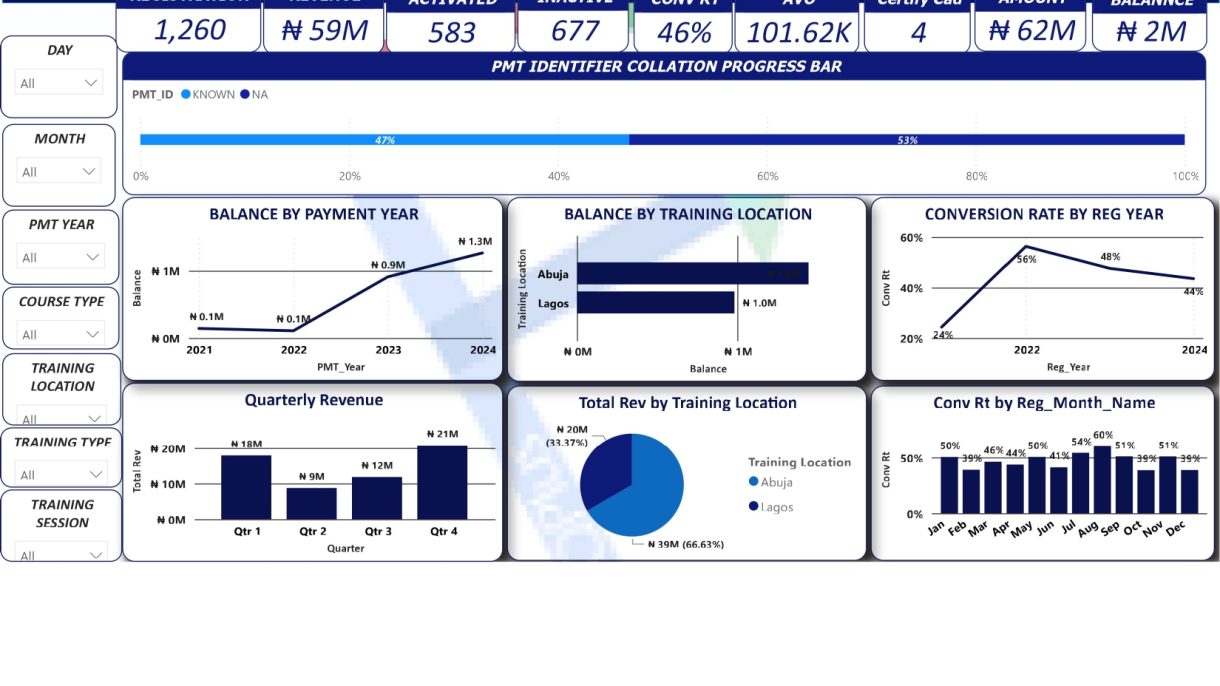
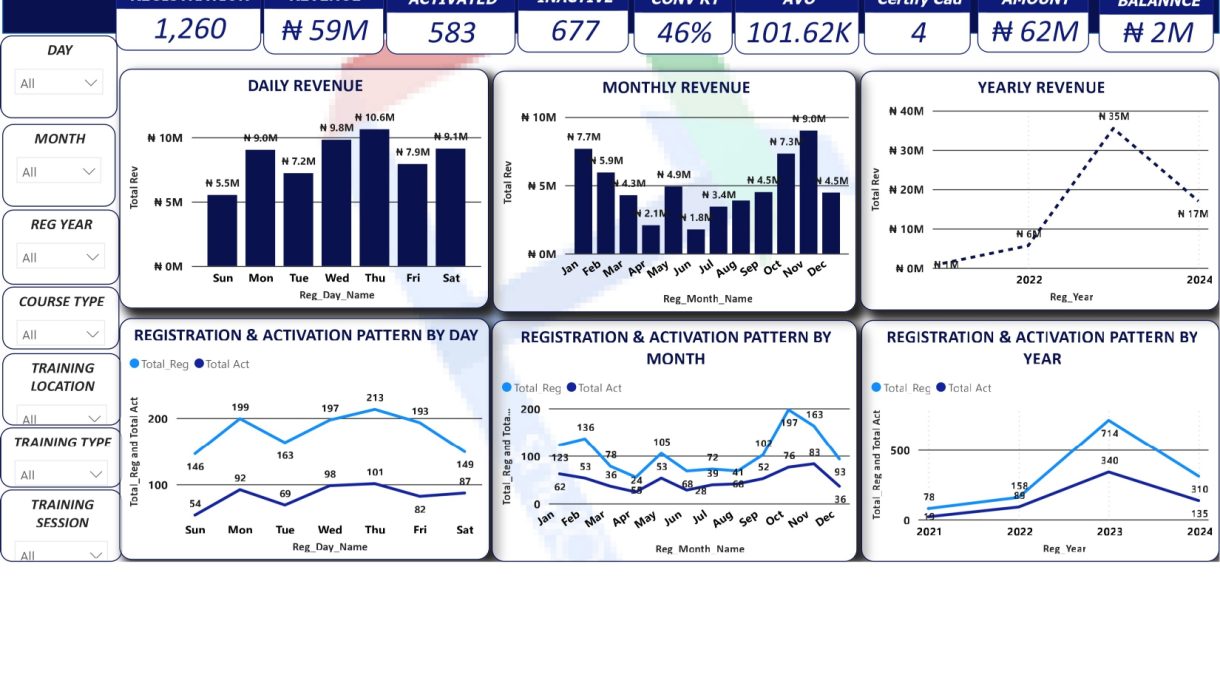
Total Revenue: Graphs showing revenue by day, month, quarter, and year.
Revenue by Time and Location: Detailed revenue breakdowns by time and location.
Conversion Rate: Charts displaying conversion rates by month and year.
Activation and Registration Patterns: Patterns of student activation and registration by day, month, and year.


