Overview:
PQPlus is implementing a strategic expansion by establishing a new training hub in the Island area of Lagos State, Nigeria. The Data Analytics and Business Intelligence team played a pivotal role in collating and analyzing Lagos Weekend and Lagos Midweek student registration data to support this decision-making process. The project aims to increase market reach, optimize revenue, and strategically grow the business.
Features:
Dashboard:
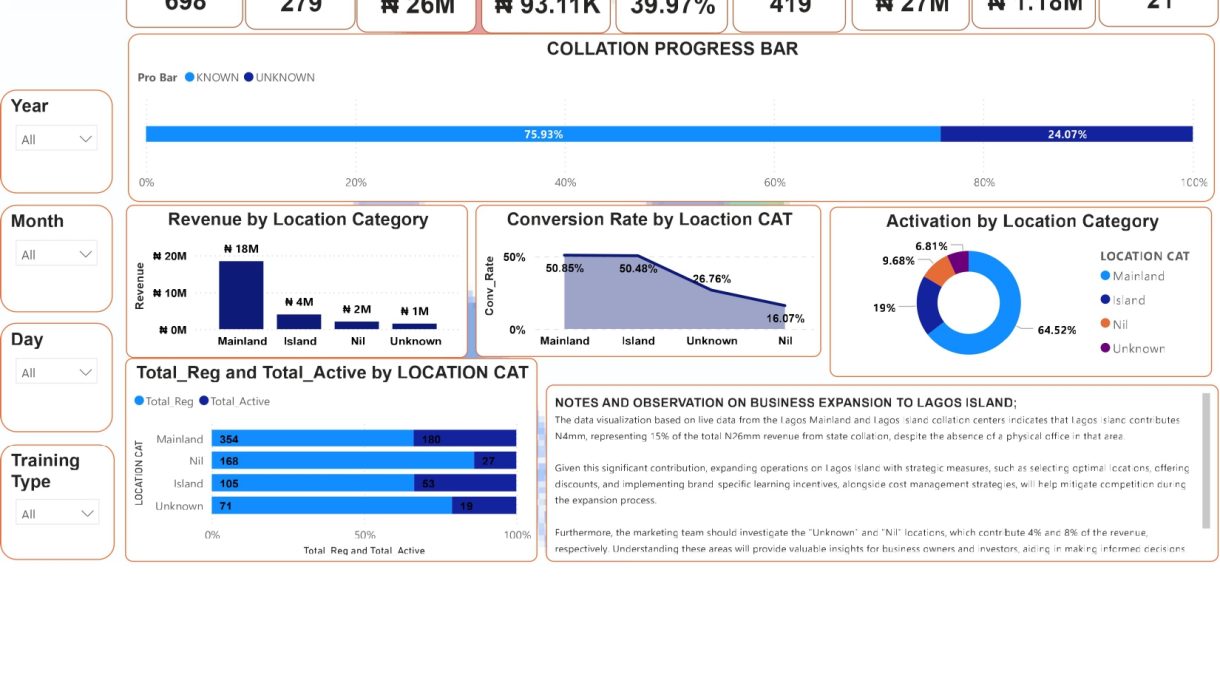
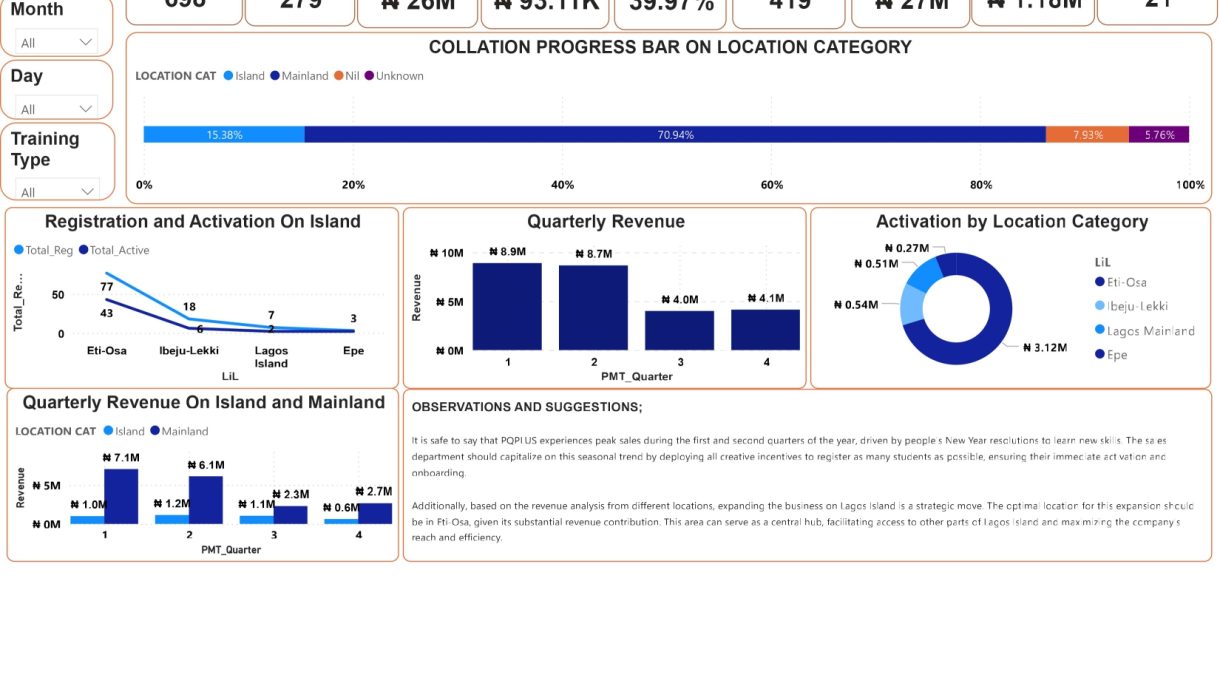
An easy-to-understand dashboard that provides real-time insights into candidate registrations, revenue generation, and the data collation process in a user-friendly format.
Technologies Used:
Power BI (ETL and Power Query) for data cleaning and transformation.
Observations:
1. Higher revenue generation observed.
2. Improved efficiency in tracking candidate registrations and payments.
3. Informed decision-making enabled by accurate data insights.
4. Targeted expansion strategy for optimal market penetration of the Island part of Lagos using the Pro Bar on the dashboard.
Design Thinking:
During the project building phase, the following were considered:
1. Tracking candidate registrations, payments, and their locations (Island or Mainland).
2. Developing a progress chart indicating data collation advancement.
3. Displaying registration distribution between the Mainland and the Island.
4. Comparing revenue from the Island area of Lagos with the Mainland.
Components of the Dashboard/Report:
1. Progress Bar
2. Conversion Rate Bar
3. Candidate Locations
4. Daily, Monthly, and Yearly Revenue
5. Location Category
6. Total Activations by Year


